


Understanding the Latest Land Betterment Charge (LBC) Revisions
Learn how Singapore’s revised Land Betterment Charge (LBC) rates affect property development. Explore the latest changes, sectoral impacts, competitive land tender outcomes, and expert strategies for managing LBC costs effectively.
1. Purpose and Context of LBC
The Land Betterment Charge (LBC) is a levy imposed when the use of land is intensified or when redevelopment enhances its value. It consolidates several older levies such as the Development Charge, Differential Premium, and Temporary Development Levy.
In Singapore, the LBC is reviewed twice a year, on 1 March and 1 September, by the Singapore Land Authority (SLA) in consultation with the Chief Valuer. These revisions ensure that the LBC reflects prevailing land values and market conditions, which are influenced by recent state land tenders and broader property market trends.
2. How LBC Works
-
When It Applies: Developers pay LBC when they seek to change land use, increase density, or redevelop sites.
-
Calculation Methods:
-
Table of Rates: Based on predefined values across 118 geographical sectors.
-
Valuation Method: Used in specific cases where land circumstances are unique.
-
-
Leasehold Adjustment: For sites with leasehold tenure of less than 99 years, an adjustment factor applies to reflect reduced residual value.
Summary of the Latest LBC Changes (Sept 1, 2025 – Feb 28, 2026)
| Use Category | Average Change | Key Notes |
|---|---|---|
| Non-Landed Residential | +0.7% | 19 sectors saw increases (2–15%), 1 sector fell slightly, rest remained flat. |
| Landed Residential | +0.4% | 13 sectors recorded rises of 3–5%, driven by strong demand in prime enclaves. |
| Commercial | +0.1% | Very marginal change; CBD and Orchard Road sectors stayed flat. |
| Industrial | +1.6% | 45 sectors rose, some by 3–10%, especially in MacPherson, Tai Seng, and Ubi. |
| Civic/Community Institutions | +2.9% | Increases across all sectors, ranging between 3–4%. |
| Hotels, Hospitals, Nursing Homes | 0% (Unchanged) | Rates held steady after a slight increase in the last cycle. |
Factors Driving the Changes
-
Competitive Land Tenders
-
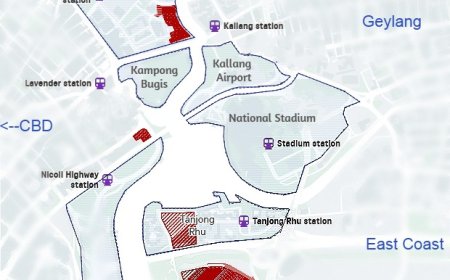
Strong bidding activity in state land tenders raised land valuations, especially in non-landed residential areas like Bayshore, East Coast, and Lorong Chuan.
-
Developers competed aggressively due to favorable financing conditions, resulting in benchmark land prices.
-
-
Favorable Market Conditions
-
Lower interest rates have reduced borrowing costs, motivating both developers and homebuyers.
-
The resurgence of collective sales in industrial precincts supported higher LBC rates in those areas.
-
-
Sectoral Variations
-
Industrial clusters such as Tai Seng and MacPherson saw notable rate increases due to recent successful transactions.
-
One-North was the rare sector where non-landed residential LBC declined slightly, reflecting softer land demand there.
-
Comparison of LBC Revisions (March 2024 – September 2025)
| Use Category | Mar 2024 Revision | Sept 2024 Revision | Mar 2025 Revision | Sept 2025 Revision | Observed Trend |
|---|---|---|---|---|---|
| Non-Landed Residential | +0.5% | +0.3% | +0.3% | +0.7% | Gradual but steady upward trend; stronger increases in 2025 due to robust GLS tenders. |
| Landed Residential | +3.0% | +2.8% | +3.0% | +0.4% | Sharp rises in 2024; stabilised in 2025 as landed demand normalized. |
| Commercial | +0.8% | +0.6% | +0.6% | +0.1% | Growth peaked in 2024; plateaued in 2025 with flat CBD and Orchard rates. |
| Industrial | +0.2% | +0.1% | +0.1% | +1.6% | Stable in 2024; strong jump in 2025 driven by collective sales in industrial clusters. |
| Civic/Community Institutions | +6.0% | +4.2% | +6.0% | +2.9% | Significant rises in 2024–early 2025; moderating by Sept 2025. |
| Hotels, Hospitals, Nursing Homes | +0.5% | +0.6% | +0.6% | 0% | Held flat after moderate increases in earlier revisions. |
Key Insights from the Comparison
-
Non-Landed Residential: After modest rises in 2024, momentum picked up in 2025 due to highly competitive GLS sites in prime areas.
-
Landed Residential: Big jumps in 2024 reflected strong demand in Holland, Bukit Timah, and Thomson areas. The 2025 revision shows much slower growth, suggesting prices may have reached temporary equilibrium.
-
Commercial: Growth slowed from 2024 into 2025, indicating stabilisation in office-dominant sectors and retail belts.
-
Industrial: The standout in 2025, with a sharp 1.6% increase—showing investor appetite and redevelopment momentum in logistics and manufacturing hubs.
-
Civic/Community Institutions: Large hikes in 2024 moderated by late 2025, but still trending upward due to continued infrastructure demand.
-
Hotels/Hospitals: After steady growth in earlier periods, this category paused—possibly reflecting cautious optimism in the hospitality and healthcare development pipeline.
Scenario Examples of LBC Impact
Scenario 1: High-Demand Non-Landed Zone
A developer purchasing a prime non-landed residential plot in Bayshore faces a 10% LBC increase. While development costs rise, the strong demand for homes in the area may offset the higher charge through premium pricing.
Scenario 2: Stable Commercial Precinct
A commercial property investor in the CBD benefits from flat LBC rates. With no added LBC burden, redevelopment or repositioning of office assets can proceed with predictable costs.
Scenario 3: Expanding Industrial Cluster
An industrial developer acquiring land in Tai Seng experiences a 9% LBC increase. Despite higher charges, the strategic location and strong logistics demand ensure long-term viability of the investment.
Expert Tips and Recommendations
-
Plan Development Timing: Submitting development applications before an LBC revision may help lock in lower rates.
-
Choose Locations Strategically: Sectors with smaller or no LBC increases may offer more cost-efficient opportunities.
-
Leverage the Valuation Method: In unique cases, the valuation approach may produce lower payable charges than the standard table.
-
Factor in Leasehold Adjustments: For land with shorter leases, ensure calculations account for the Leasehold Table, which reduces payable amounts.
-
Balance Cost vs. Value: Paying higher LBC in prime zones may still yield strong returns due to buyer demand and resale premiums.
Key Takeaways
-
LBC rates are revised twice yearly and directly reflect land tender results and broader market dynamics.
-
Non-landed residential, industrial, and civic/community sectors saw the most notable increases in the latest cycle.
-
Developers must carefully consider LBC when evaluating project feasibility, particularly in high-demand areas.
-
Strategic planning around timing, location, and calculation methods can help manage or reduce LBC impact.
Frequently Asked Questions (FAQ)
-
What is the Land Betterment Charge (LBC)?
A levy on the increase in land value when land use is changed or intensified. -
Who determines LBC rates?
The Singapore Land Authority, in consultation with the Chief Valuer. -
How often are rates revised?
Twice yearly—on 1 March and 1 September. -
Why did non-landed residential LBC increase the most?
Competitive bids in state land tenders raised land valuations in several prime areas. -
Which sector saw a decrease?
One-North, due to less aggressive bidding and weaker land demand. -
Do higher LBC rates discourage developers?
Usually not, as increases are modest relative to total development costs. -
What is the Table of Rates method?
A standardized schedule of charges by sector and land use category. -
What is the Valuation Method?
A case-specific calculation of LBC based on land value uplift, often used when sites have special circumstances. -
Are leasehold properties affected differently?
Yes—sites with leases under 99 years are adjusted using the Leasehold Table. -
Which sectors saw the largest rise this cycle?
Non-landed residential in Bayshore and East Coast, and industrial areas like Tai Seng. -
Why did commercial LBC barely change?
Demand in central business and shopping districts remained stable. -
Do LBC revisions affect property prices directly?
Indirectly—higher development costs may influence launch pricing, but market demand remains a stronger driver. -
Can developers avoid paying LBC?
Not if redevelopment or intensification occurs; however, strategic timing can reduce payable amounts. -
How important is LBC compared to other costs?
It is only a portion of overall development cost but still relevant for profitability. -
What can buyers or investors learn from LBC revisions?
They offer insight into where demand is strong and where new developments are likely to emerge.
Algene Toh

Disclaimer: The information presented on BSR2.com is intended for general informational purposes only. It does not constitute legal, financial, investment, or real estate advice and should not be relied upon as such. While every effort has been made to ensure the accuracy, reliability, and completeness of the content at the time of publication, all data is derived from publicly available sources and may be subject to change without notice. BSR2.com makes no representations or warranties of any kind, express or implied, regarding the suitability, timeliness, or accuracy of the information provided for any specific purpose. Users are strongly encouraged to seek independent advice from qualified professionals before making any decisions based on the content found on this website. BSR2.com shall not be held liable for any loss, damage, or consequence, whether direct or indirect, arising from the use of or reliance on the information provided. The content is intended as a general guide and does not take into account individual circumstances.
What's Your Reaction?
 Like
0
Like
0
 Dislike
0
Dislike
0
 Love
0
Love
0
 Funny
0
Funny
0
 Angry
0
Angry
0
 Sad
0
Sad
0
 Wow
0
Wow
0